

Engagement is a Key Measure for Consumer Platforms
I cover consumer technology companies for my job. Engagement on consumer tech applications is a key indicator of their success or potential for success and is measured as time spent on the app each day. Engagement is the single most important factor in determining relevance and potential value of a consumer application. Users, growth, monetization and everything else we consider important follows after engagement. Because of its importance as the key indicator for an application’s success, it is often a number that the app owners hold close to the vest, especially when engagement begins to trend downward.
It’s Difficult to Find Comparable Engagement Data
In addition, key social and consumer technology platforms are experiencing some backlash in the wake of privacy scandals, data and personal information leaks, questions from governments about their role in creating technology dependency and addiction. Tech companies used to tout usage/time spent on the app as a badge of honor. At the time of its IPO Facebook users spent a collective 9.7 billion minutes per day — or 20 minutes for each of its 483 million daily active users as of December 2011 — spent on the platform to post more than 2.7 billion likes & comments per day and to upload 250 million photos per day. Today those usage numbers are not as readily disclosed and companies like Facebook are actively providing tools for users to monitor and manage their Facebook usage.
All of this is to say — time spent on mobile apps is important to know, and this information is becoming harder to come by.
Here is the Data and Some Observations
Recently, I spent several hours (probably 20+ over the course of a couple of weeks) compiling the most recent, relevant, and comparable information to benchmark the time spent on key consumer platforms. The order of the applications, from most to least time spent, is probably about what you’d expect if you had to make an estimate. The average time spent is probably a little higher than you think you spend yourself (but check your iPhone “Screen Time” to be sure), but there are a few important notes to point out…
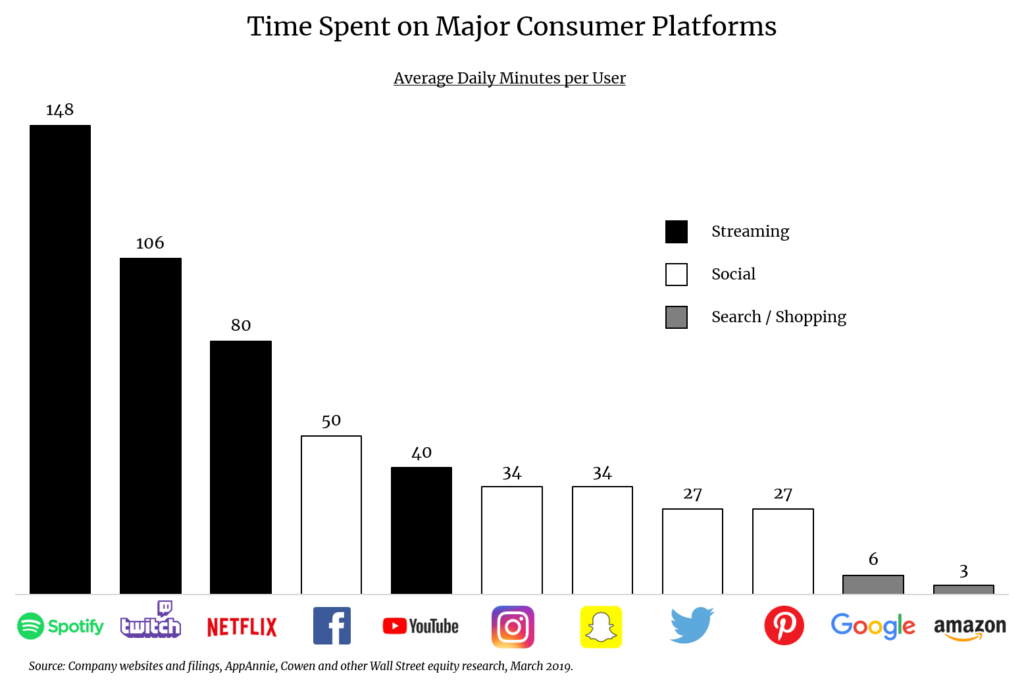
Streaming services like Spotify, Twitch and Netflix are used for the longest duration given they are longer-form content and passively consumed, whereas the social platforms require constant engagement (clicks, likes, comments), which lead to less time spent. I believe YouTube would be higher in consumption but for the fact that its content is generally known to be short-form or medium-form in the first place. Google and Amazon are very much transaction-based sites. We go to Google to do a quick search, and we go to Amazon to buy something we know we need. Opposite of Amazon is a platform like Pinterest, where the user is looking for inspiration before making a purchase. One of Pinterest’s challenges is maintaining its “inspiration” feel and keeping consumers engaged, while also transforming itself into a commerce site. The worst case for Pinterest is that its users spend all their time on Pinterest deciding what to buy, then ultimately flip over to Amazon to make the purchase. By making pins shoppable Pinterest has made some big strides in this area, and investors like what they are seeing. The company went public in April 2019 and its stock is up 42% in the first 5 months since the IPO.
When and where have you ever seen this information presented clearly and comparably anywhere in the last 5 years? Well, now you have it, or at least the most closely comparable data we can independently observe or tie back to primary sources.